Using the Scanner
At first glance, SoccerScanner’s main interface might seem overwhelming, but it’s actually designed for intuitive, visual market trading. With a little guidance, you’ll quickly get the hang of it!
For a step-by-step walkthrough, check out our online video guide—click to watch now!
Understanding the Icons
The icons across the top are crucial for interpreting market activity. Let’s break them down so you can maximize your trading experience. (Click on an image to see it full screen)
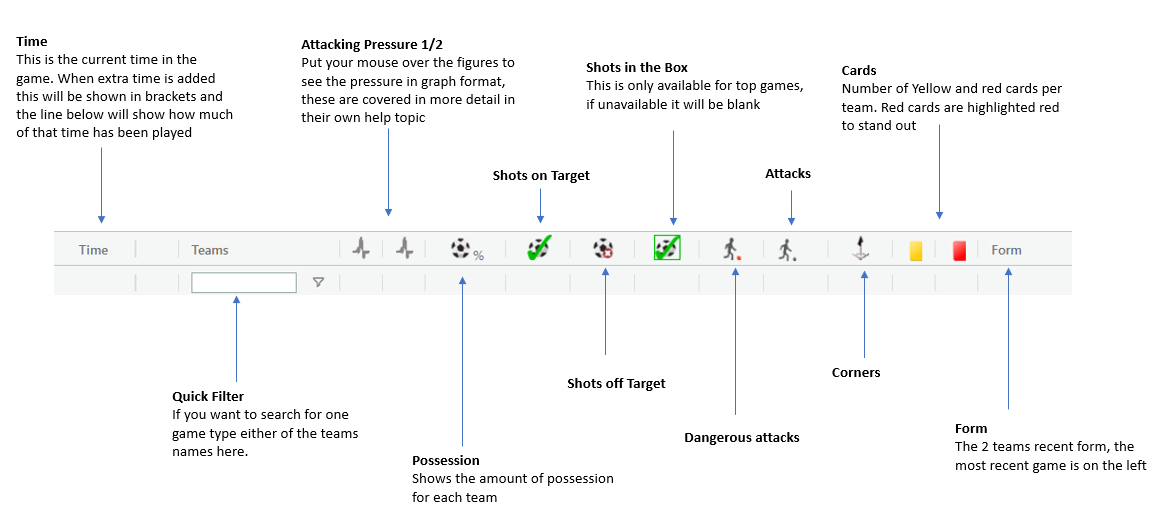
If you forget what an Icon does, simply place your mouse over the icon for a few seconds and a reminder will pop up.
Understanding SoccerScanner’s Shaded Cells
SoccerScanner visually highlights team dominance by shading cells based on statistical values, making it easy to identify who is on top.
Example Breakdown
In this Turkish league match, Yomraspor has had double or more shots on target, so their cell is shaded dark blue. Meanwhile, the away team has had double or more shots off target, resulting in a light blue shade. These colors help quickly pinpoint when a team is in control—especially when multiple cells are shaded.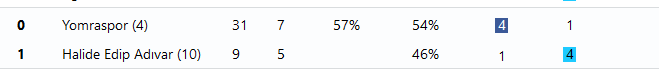
Spotting a Potential Comeback
In the example below, the home team is trailing 3-1, but the stats suggest a possible turnaround. The fields on the right track the last 10 minutes, showing that while the home side has had 5 total shots on target, 3 of them occurred in the past 10 minutes. This is where SoccerScanner truly shines—the pattern of play favors the home team, and the number of dark blue cells makes this easy to recognize at a glance.
And sure enough on 53 mins they pulled a goal back, its not always this easy but the signs were there

The colour-coded system is designed to help users make smarter, data-driven betting decisions with minimal effort.